|
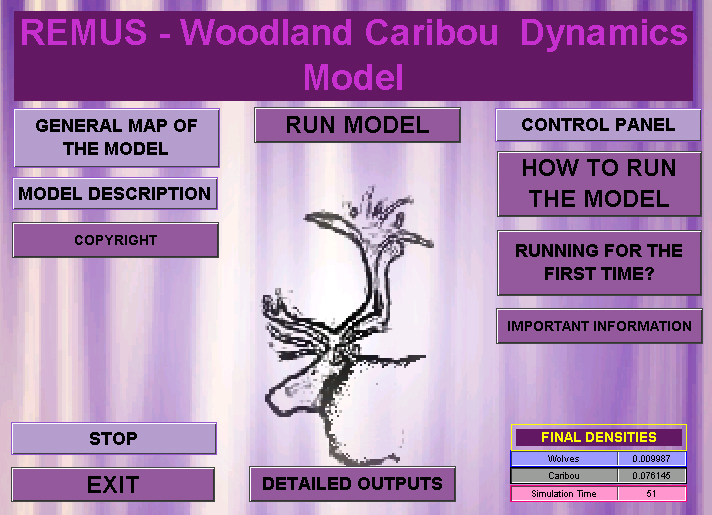
In this section some sample screens from REMUS are presented to give you a better idea about the model’s interface. Other screens are discussed in the sections describing model outputs and tutorial. Please note that for Internet purposes the screens illustrated below were reduced in size. This decreased the quality of graphics displayed. The actual interface of REMUS is of much higher quality. First Screen
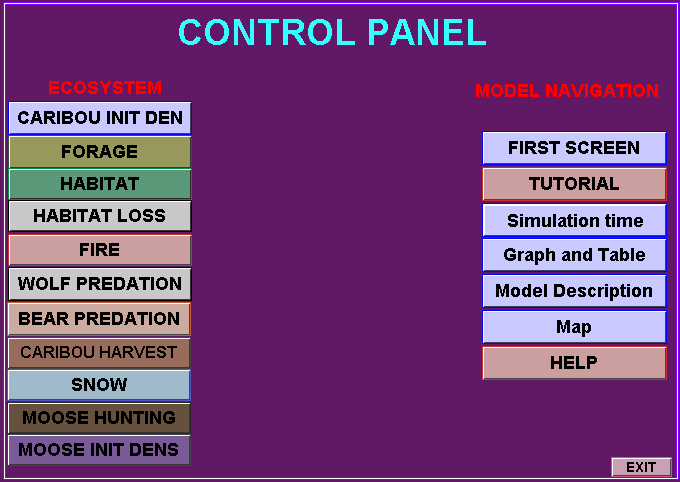
This is the first screen of REMUS. It opens when you start the model. From here you can access the tutorial, control pannel, general map of the model and the description of the model. From this screen you can also run simulations and access the outputs generated. Finally, you can exit the model. Control Panel The
control panel screen is organized in two sections: 1) ecosystem and
2) model navigation.
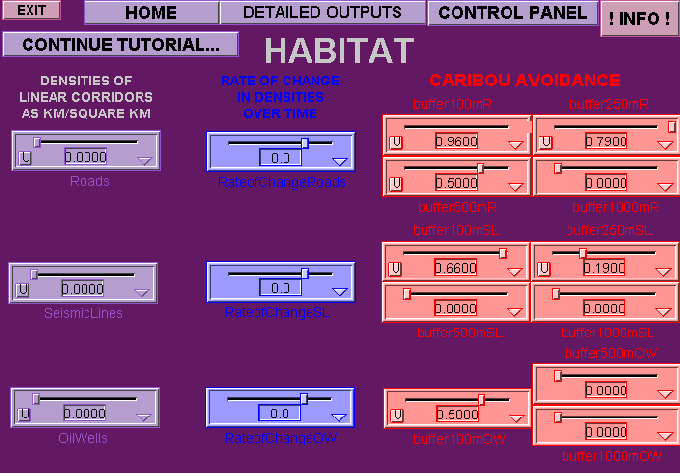
Habitat Loss
The habitat loss screen allows you to specify the densities of industrial infrastructures (e.g. roads, oil wells, seismic lines, etc.) present on caribou range. Here, you can also set the rate of change of these structures over time (decreasing, increasing or static), as well as caribou use of buffer areas (habitats in the immediate proximity of industrial structures).
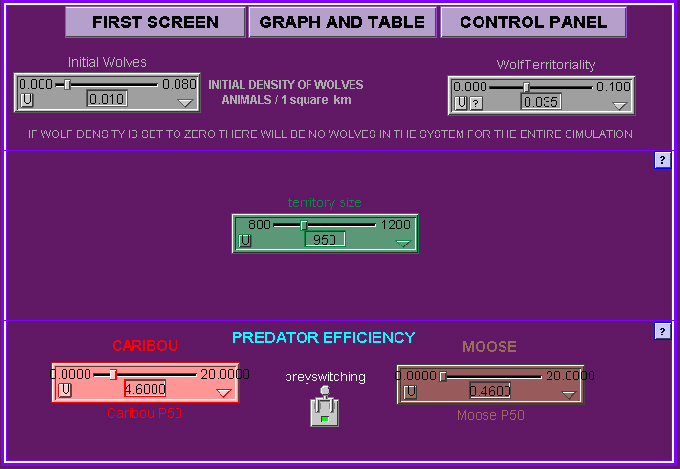
Predation:
The controls describing wolf predation are presented in the screen above. In this case you can decide on the initial density of wolves, their territory sizes and the maximum wolf density that will not be exceeded due to social spacing behavior of wolves. Next, you can specify wolf kill rates (how efficient wolves are in utilizing prey), and what the preferred prey is. You will also be able to simulate the dynamics of the system with potential prey switching or without it.
Many
other elements of the modeled system can be adjusted for you specific
purposes in REMUS simulations (see the tutorial and model description).
The screens presented above illustrate selected elements only.
BACKGROUND | DESCRIPTION | TUTORIAL | OUTPUTS | HOME | OTHER USES | LITERATURE | SCREENS | FUTURE | CONTACT copyrightăPiotr
Weclaw, 2003, 2004 |